Object intensity measurements
Prerequisites
Before starting this lesson, you should be familiar with:
Learning Objectives
After completing this lesson, learners should be able to:
Understand the correct biophysical interpretation of the most common object intensity measurements
Perform object intensity measurements
Motivation
The measurement of intensities in biological images is very common, e.g. to quantify expression levels of certain proteins by means of immuno-histochemistry. However, performing correct intensity measurements is very tricky and there are a lot of pitfalls. It is thus of utmost important to understand very well what one is doing. Without in-depth understanding the chance to publish wrong results based on intensity measurements is rather high.
Concept map
Columns: Features
e.g., mean, sum, max"]
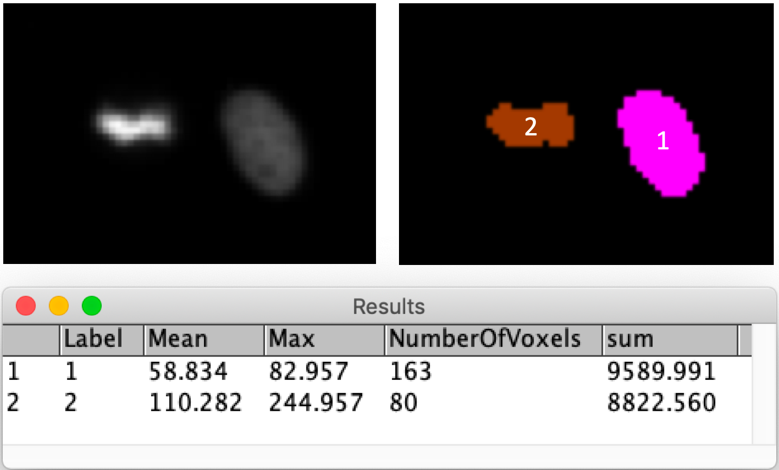
Example figure
Background correction
In this module the images that we work are background corrected, meaning that the average intensity in regions without objects is zero. In general this is not the case and, in fact, proper background correction is a super important and very often also quite difficult task in bioimage analysis. There are thus several modules dedicated to background correction for intensity measurements. See below “Learn next” section.
Key points
- Intensity measurements are generally very tricky and most likely the source of many scientific mistakes. Please always consider consulting an bioimage analysis expert!
- Intensity measurements need a background correction. This can be achieved in several ways.
- At least, think carefully about whether the mean or sum intensity is the right readout for your biological question.
- If you publish or present something label your measurement properly, e.g. “Sum Intensity”. Just “Intensity” is not enough!
- Objects based intensity measurements require two input images: the (background corrected) intensity image and a label mask image.
Activity
- Open image xy_float__h2b_bg_corr.tif
- Appreciate that the mean intensity in the background is zero.
- Open label mask xy_8bit_labels__h2b_bg_corr
- Measure the mean, max and sum intensities in both objects. For the sum measurements explain how to compute it and perform it in, e.g. excel or R.
- Discuss the measurements’ biophysical interpretation
- The signal is H2B in a dividing and in an interphase cell.
- Importantly, this was acquired with a widefield microscope!
- The interpretation for a confocal microscope would be different!
- Discuss that it is not really clear how large exactly the label regions have to be
- Open label mask xy_8bit_labels__larger_regions_h2b_bg_corr
- Display the label mask on top of the raw image [Image > Overlay > Add Image…]
- Measure the intensities again, one with the larger label mask
- Discuss which values changed and by how much percent
ImageJ Macro & GUI
/**
 * Nuclei intensity measurments
 *
 * Requirements:
 *   - Update site: IJPB-Plugins (MorpholibJ)
 *
 */

run("Close All");
run("Options...", "iterations=1 count=1 black do=Nothing");

/**
 * Open the images, change their names, LUTs, and sizes
 */

open("https://github.com/NEUBIAS/training-resources/raw/master/image_data/xy_float__h2b_bg_corr.tif");
rename("intensity");
run("Set... ", "zoom=400");

open("https://github.com/NEUBIAS/training-resources/raw/master/image_data/xy_8bit_labels__h2b_bg_corr.tif");
//open("https://github.com/NEUBIAS/training-resources/raw/master/image_data/xy_8bit_labels__larger_regions_h2b_bg_corr.tif");
rename("labels");
run("glasbey_on_dark");
run("Set... ", "zoom=400");

run("Tile");

/**
 * Display labels as overlays
 **/
selectWindow("intensity");
run("Add Image...", "image=labels x=0 y=0 opacity=50");

/**
 * Measure object intensities
 */

// Plugins › MorphoLibJ › Analyze › Intensity Measurements 2D/3D
run("Intensity Measurements 2D/3D", "input=intensity labels=labels mean max numberofvoxels");

/**
 * Add  sum intensity measurement
 */

IJ.renameResults("Results"); // otherwise below does not work...
for (row=0; row<nResults; row++) {
	sum = getResult("NumberOfVoxels", row) * getResult("Mean", row);
    setResult("sum", row, sum);
}
updateResults();
Exercises
Show exercises for:ImageJ Macro & GUI
Open the intensity image xy_8bit__nup_bgsubtracted.tif. The image shows the intensity of a nuclear pore protein (NUP) on the nuclear membrane. Open the binary image xy_8bit_binary__nup.tif
- Generate a label image and compute the mean intensity for each nucleus.
- Calculate the total intensity of the NUP for each nucleus.
Solution
The total intensity can be computed by multiplying the number of pixels with the mean intensity.
/**
 * Required update sites:
 *   - IJPB-Plugins (MorpholibJ)
 */

 run("Close All");
 // File > Open
 open("https://github.com/NEUBIAS/training-resources/raw/master/image_data/xy_8bit__nup_bgsubtracted.tif");
 rename("intensity")
 // Image > Adjust > Brightness/Contrast... Auto
 run("Enhance Contrast", "saturated=0.35");
 // File > Open
 open("https://github.com/NEUBIAS/training-resources/raw/master/image_data/xy_8bit_binary__nup.tif");
 rename("binary")
 // Create label image;
 // Plugins › MorphoLibJ › Binary Images › Connected Components Labeling
 run("Connected Components Labeling", "connectivity=4 type=[8 bits]");
 rename("labels")
 // Measure intensities
 // Plugins > MorpholibJ > Analyze > Intensity Measurements 2D/3D
 run("Intensity Measurements 2D/3D", "input=intensity labels=labels mean max min median numberofvoxels");
- Display the label image on top of the intensity image using an Overlay ([Image > Overlay > Add Image…]). Which measurement could be problematic?
Solution
The label mask for label 3 also includes parts that are probably not part of the nuclear membrane.
 run("Close All");
 // File > Open
 open("https://github.com/NEUBIAS/training-resources/raw/master/image_data/xy_8bit__nup_bgsubtracted.tif");
 rename("intensity")
 // Image > Adjust > Brightness/Contrast... Auto
 run("Enhance Contrast", "saturated=0.35");
 // File > Open
 open("https://github.com/NEUBIAS/training-resources/raw/master/image_data/xy_8bit_labels__nup.tif");
 rename("labels")
 // Check if label mask fit our expected rim
 // Image > Overlay > Add Image...
 selectWindow("intensity");
 run("Add Image...", "image=labels x=0 y=0 opacity=50");
 run("Tile")
Assessment
Fill in the blanks (discuss with your neighbour)
Fill in the blanks, using these words: number of pixels, integrated, mean, decrease, increase, increase, sum, decrease
- Average intensity is just another word for ____ intensity.
- Sum intensity is sometimes also called ____ intensity.
- The ____ intensity is equal to the mean intensity times the ____ in the measured region.
- In an unsigned integer image, increasing the size of the measurement region can only _____ the sum intensity.
- In an unsigned integer image, decreasing the size of the measurement region can ____ or ____ the mean intensity.
- In a floating point image, increasing the size of the measurement region could ____ the sum intensity.
Solution
- mean
- integrated
- sum, number of pixels
- increase
- decrease, increase
- decrease
Follow-up material
We recommend reading these modules next:
Learn more: