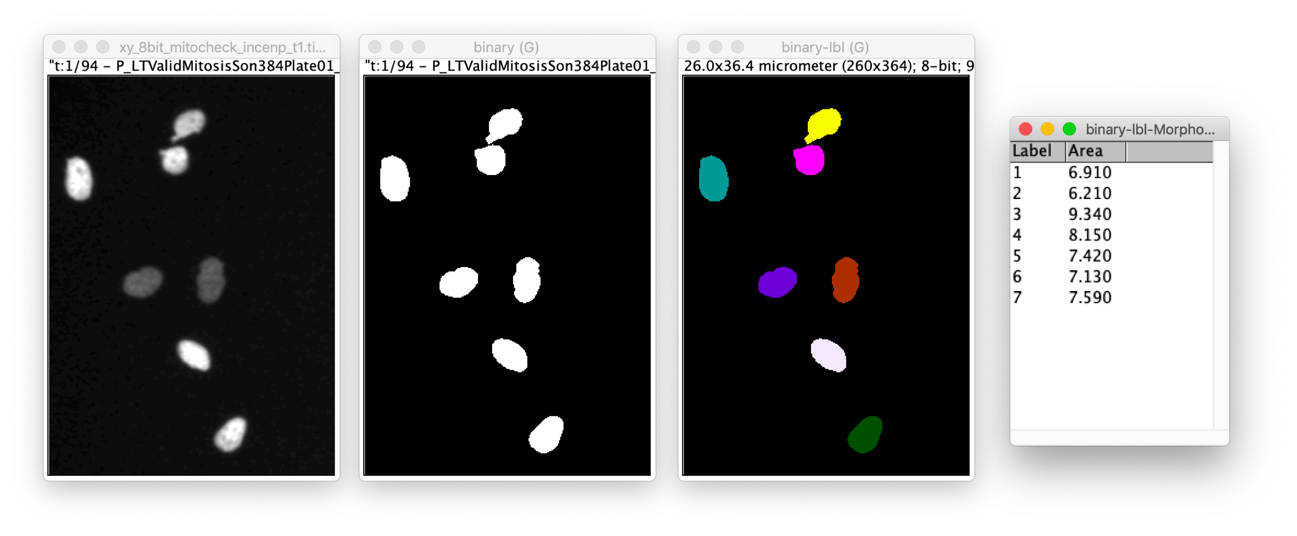
Workflow - Simple 2D object analysis
Prerequisites
Before starting this lesson, you should be familiar with:
Learning Objectives
After completing this lesson, learners should be able to:
Create a simple image analysis workflow.
Understand that bioimage analysis workflows consist of a sequence of image analysis components.
Segment nuclei in a 2D image and measure their shapes and understand the different components (concepts and methods) that are needed to accomplish this task.
Draw a biophysically meaningful conclusion from applying an image analysis workflow to a set of images.
Motivation
Detecting a set of objects in an image, counting them and measuring certain characteristics about their morphology is probably the most frequently occurring task in bioimage analysis. Depending on the image, even this task could become quite challenging and the workflow could become quite complex. Here we start with a relatively easy image where combining a minimal set of image analysis components into a simple workflow does the job.
Concept map
Example figure

Activity
Input images
The images are two time points of a time lapse experiment where the INCENP gene was subjected to siRNA knock-down. The data are taken from the published mitocheck screen. In this screen the authors carried out a genome-wide phenotypic profiling of each of the ~21,000 human protein-coding genes by two-day live imaging of fluorescently labelled chromosomes. Phenotypes were scored quantitatively by computational image processing, which allowed them to identify hundreds of human genes involved in diverse biological functions including cell division, migration and survival.
The analysis that we do here is, of course, simpler than what the authors did in the publication, but the essence is already very similar. In addition, to simplify the task we work here on images that were cropped and slightly denoised.
Workflow:
Apply the workflow outlined above (see Concept map) to both images (the modules lists in above “Prerequisites” contain the information as to how to conduct each step of the workflow). The nuclei in both images look quite different. Find shape measurements that quantify this.
Show activity for:ImageJ Macro & GUI
/**
 * 2D Nuclei segmentation (simple workflow)
 *
 * Requirements:
 *   - Update site: IJPB-Plugins (MorpholibJ)
 *
 */

run("Close All");
run("Options...", "iterations=1 count=1 black do=Nothing");

analyseNuclei( "INCENP_T1", "https://github.com/NEUBIAS/training-resources/raw/master/image_data/xy_8bit__mitocheck_incenp_t1.tif" );
analyseNuclei( "INCENP_T70", "https://github.com/NEUBIAS/training-resources/raw/master/image_data/xy_8bit__mitocheck_incenp_t70.tif" );
run("Tile");

function analyseNuclei( name, filePath )
{
	// File › Open...
	open(filePath);
	// Image › Rename...
	rename(name);
	// Image › Adjust › Brightness/Contrast...
	setMinAndMax(0, 100);
	// Image › Duplicate...
	run("Duplicate...", "title=" + name + "_binary" );
	// Image › Adjust › Threshold...  [ Apply ]
	setThreshold(25, 255);
	run("Convert to Mask");
	// Plugins › MorphoLibJ › Binary Images › Connected Components Labeling
	run("Connected Components Labeling", "connectivity=4 type=[8 bits]");
	// Image › Lookup Tables › glasbey_on_dark
	run("glasbey_on_dark");
	// Plugins › MorphoLibJ › Analyze › Analyze Regions
	run("Analyze Regions", "area");
}
Assessment
Follow-up material
We recommend reading these modules next:
Learn more: